


Climate change has a significant impact on our supply chain,
customers, and operations, and its effects are being felt
worldwide. This means that we not only have a responsibility
to transition to low-carbon practices but also to protect our
assets from climate events and meet regulatory and customer
expectations. We focus on addressing climate change by
embracing low-carbon transition and building resilience.
Over the past decade, we have diligently tracked our Scope 1
and Scope 2 emissions, achieving significant reductions in both
absolute and intensity terms. Our commitment to sustainability is
reflected in our 2025 and 2030 targets set to further reduce the
intensity of these emissions. In the previous year, we conducted
a thorough inventory of our Scope 3 emissions and developed
strategies to mitigate value chain emissions, with a focus on
our sustainable supply chain program as the primary driver.
Additionally, we took proactive measures by conducting a climate
scenario analysis, risk assessment, and planning activities to
enhance our responsiveness to climate change, aligning with the
Task Force on Climate-related Disclosures (TCFD).

Decarbonisation at Asian Paints
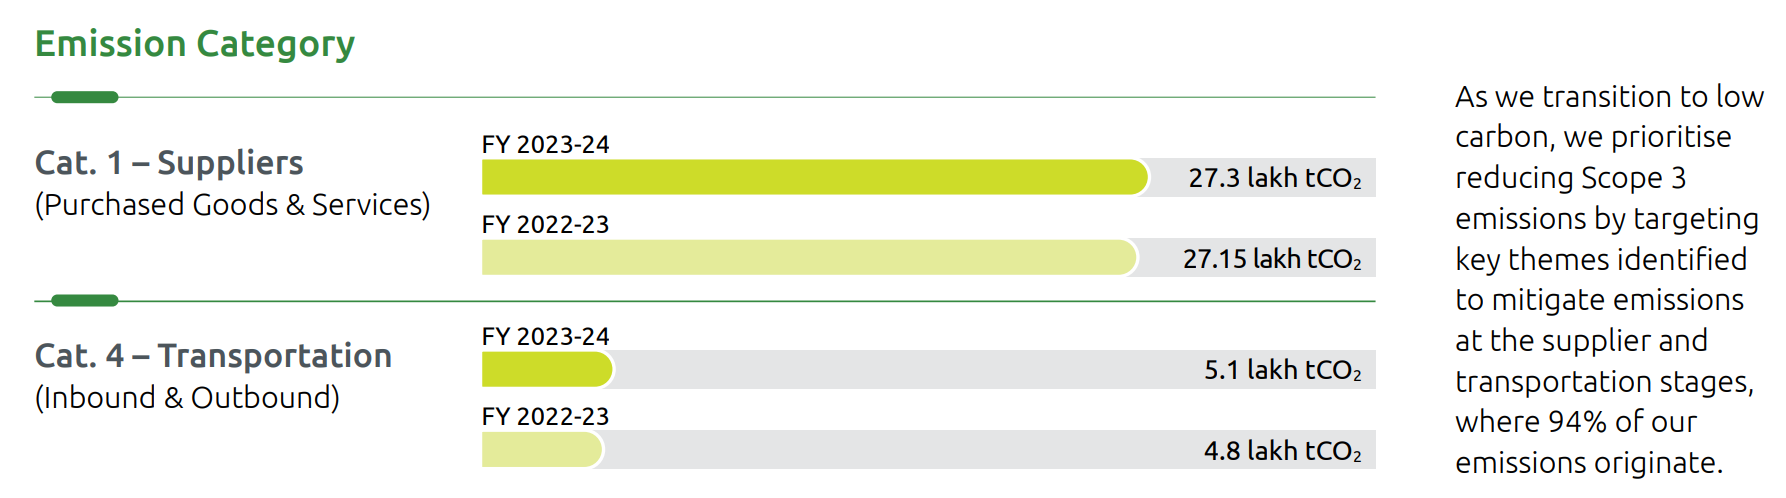
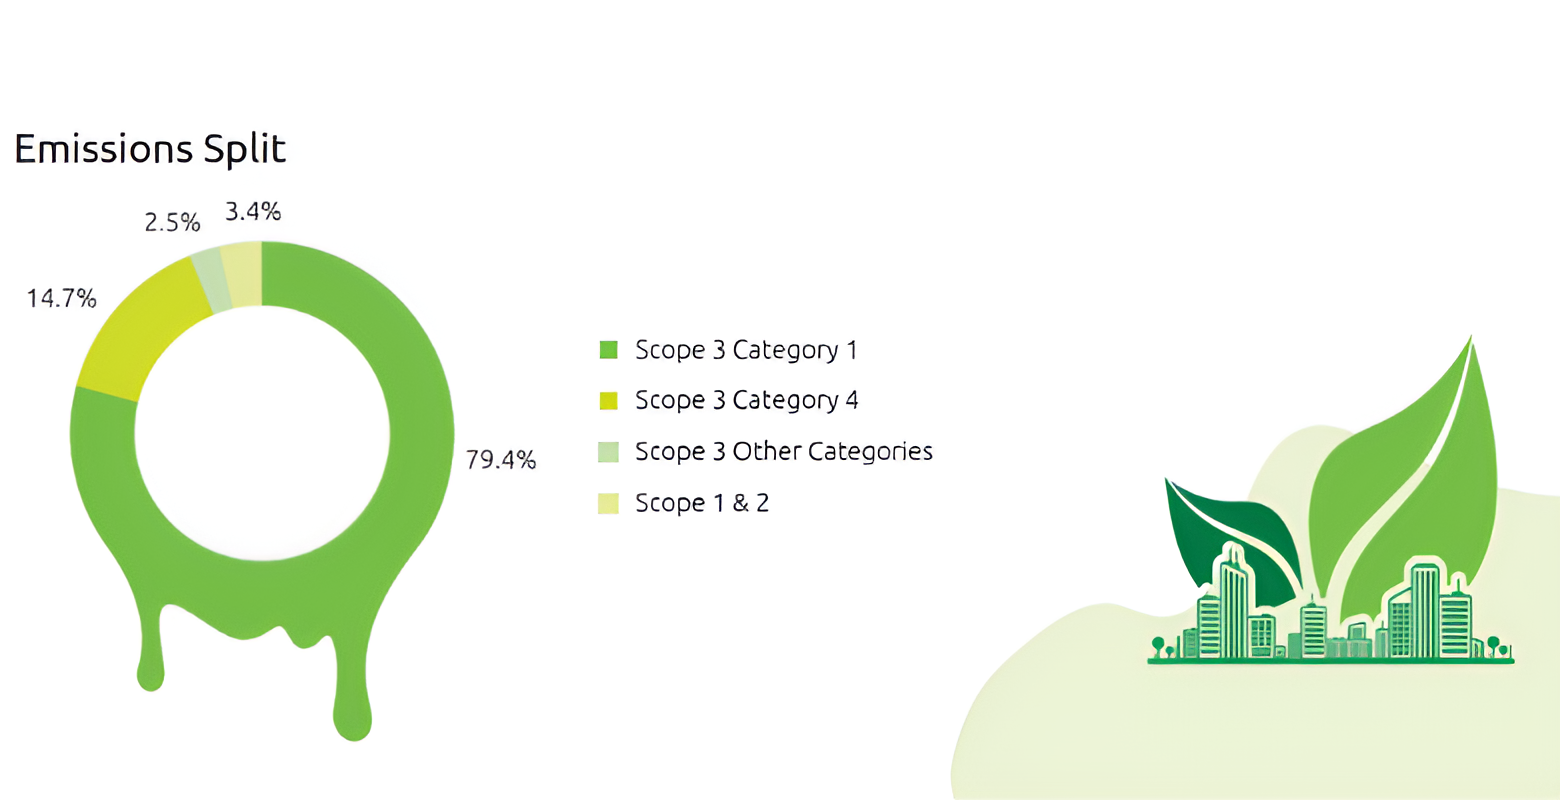
Our commitment to reducing our carbon footprint entails a comprehensive assessment of emissions generated from both our operations and the entire value chain. Emissions stemming from our operations are largely attributed to the use of fuels and grid electricity, whereas the majority of emissions within the value chain originate from suppliers and transportation. Energy and resource utilisation directly contribute to the majority of these emissions. Our decarbonisation strategy focusses on the following key enablers addressing both direct and indirect emissions.

Key enablers to address emissions at different value chain stages have been illustrated below:

Own operations – Scope 1 and Scope 2 emissions
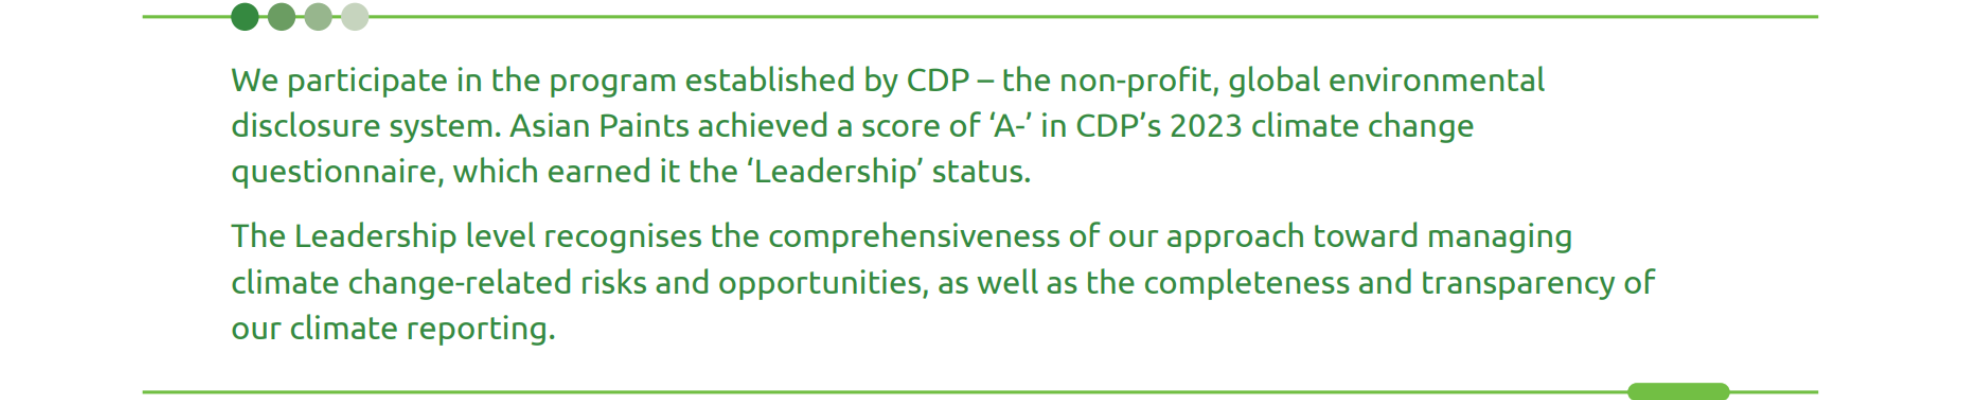
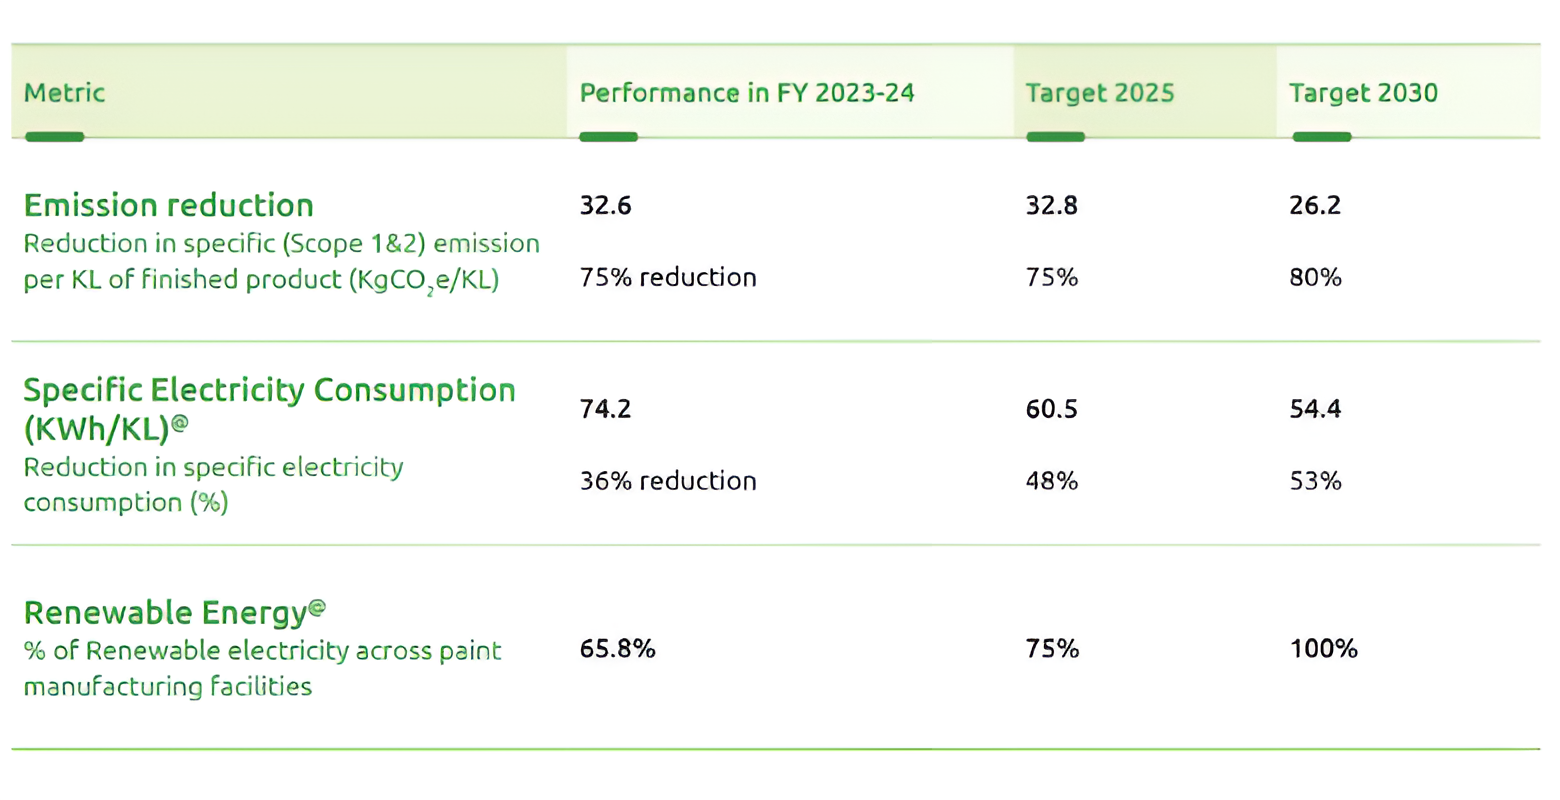
Over the decade, we have achieved significant reductions in absolute Scope 1 and Scope 2 emissions in our decorative paint business. We have reduced our Scope 1 emissions by 41% and our Scope 2 emissions by 47% from FY 2013-14. In addition, our emission intensity decreased by 75% from the baseline year, achieving the 2025 commitment ahead of schedule. The Scope 1 and Scope 2 emissions on a standalone basis during the year were 72,794 tCO2 e & 44,357 tCO2 e respectively. The emission intensity was 88.6 KgCO2 e/KL. Biogenic emission due to the combustion of biofuels was 338 tCO2 e.
E1: Energy Efficiency
Efficient energy consumption is a key enabler of the
reduction of our Scope 1 and Scope 2 emissions. Our
commitment to lower energy usage depends on process
enhancements, investments in advanced technologies, and
upgrading existing infrastructure to incorporate energyefficient assets. This is further supported by constant
trainings and awareness campaigns on energy efficiency.
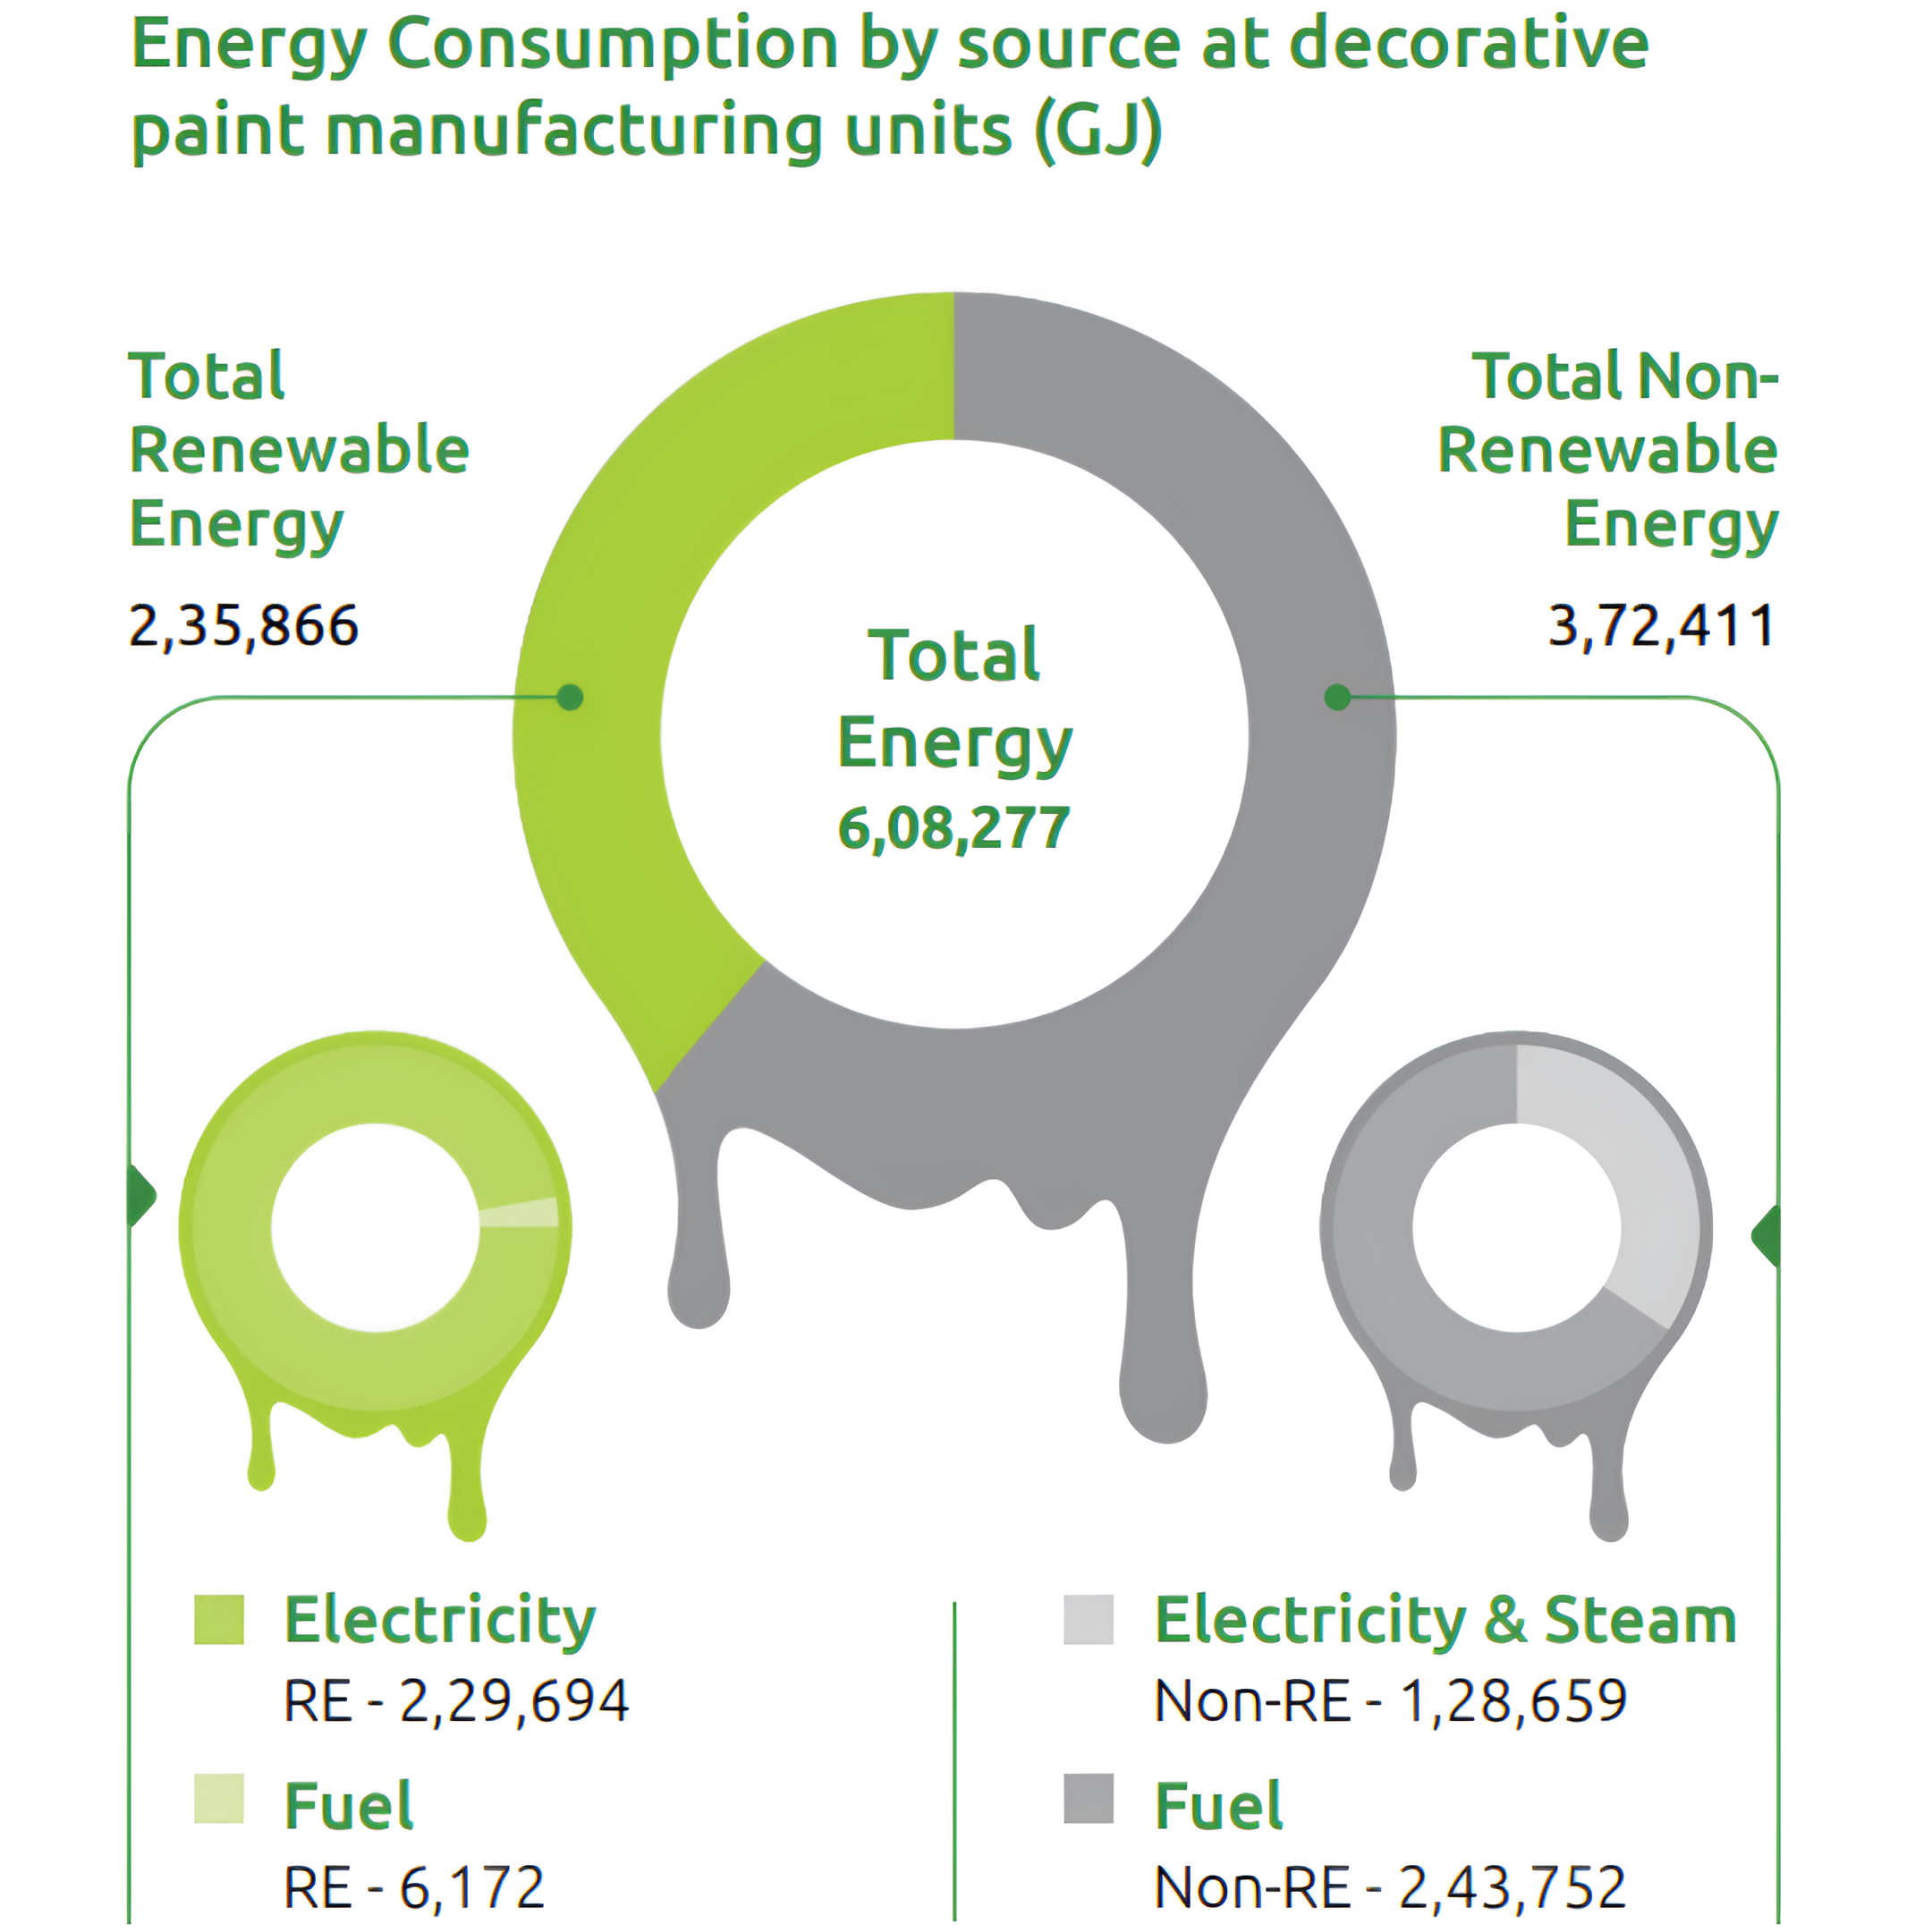
During the year, the total energy consumption at our
decorative paint manufacturing units stood at 6,08,277 GJ,
and renewable energy consumption contributed 2,35,866 GJ.
We have been monitoring and concentrating on Specific
Electricity Consumption reduction at our decorative paint
manufacturing units.
In FY 2023-24, total energy consumption on a standalone
basis stood at 12,92,545 GJ, of which 9,33,022 GJ contributed
to direct energy consumption and 3,59,523 GJ contributed
to indirect energy consumption. During the year, 12,329 GJ
of steam was procured and included in indirect energy. The
energy intensity was 0.98 GJ/KL.

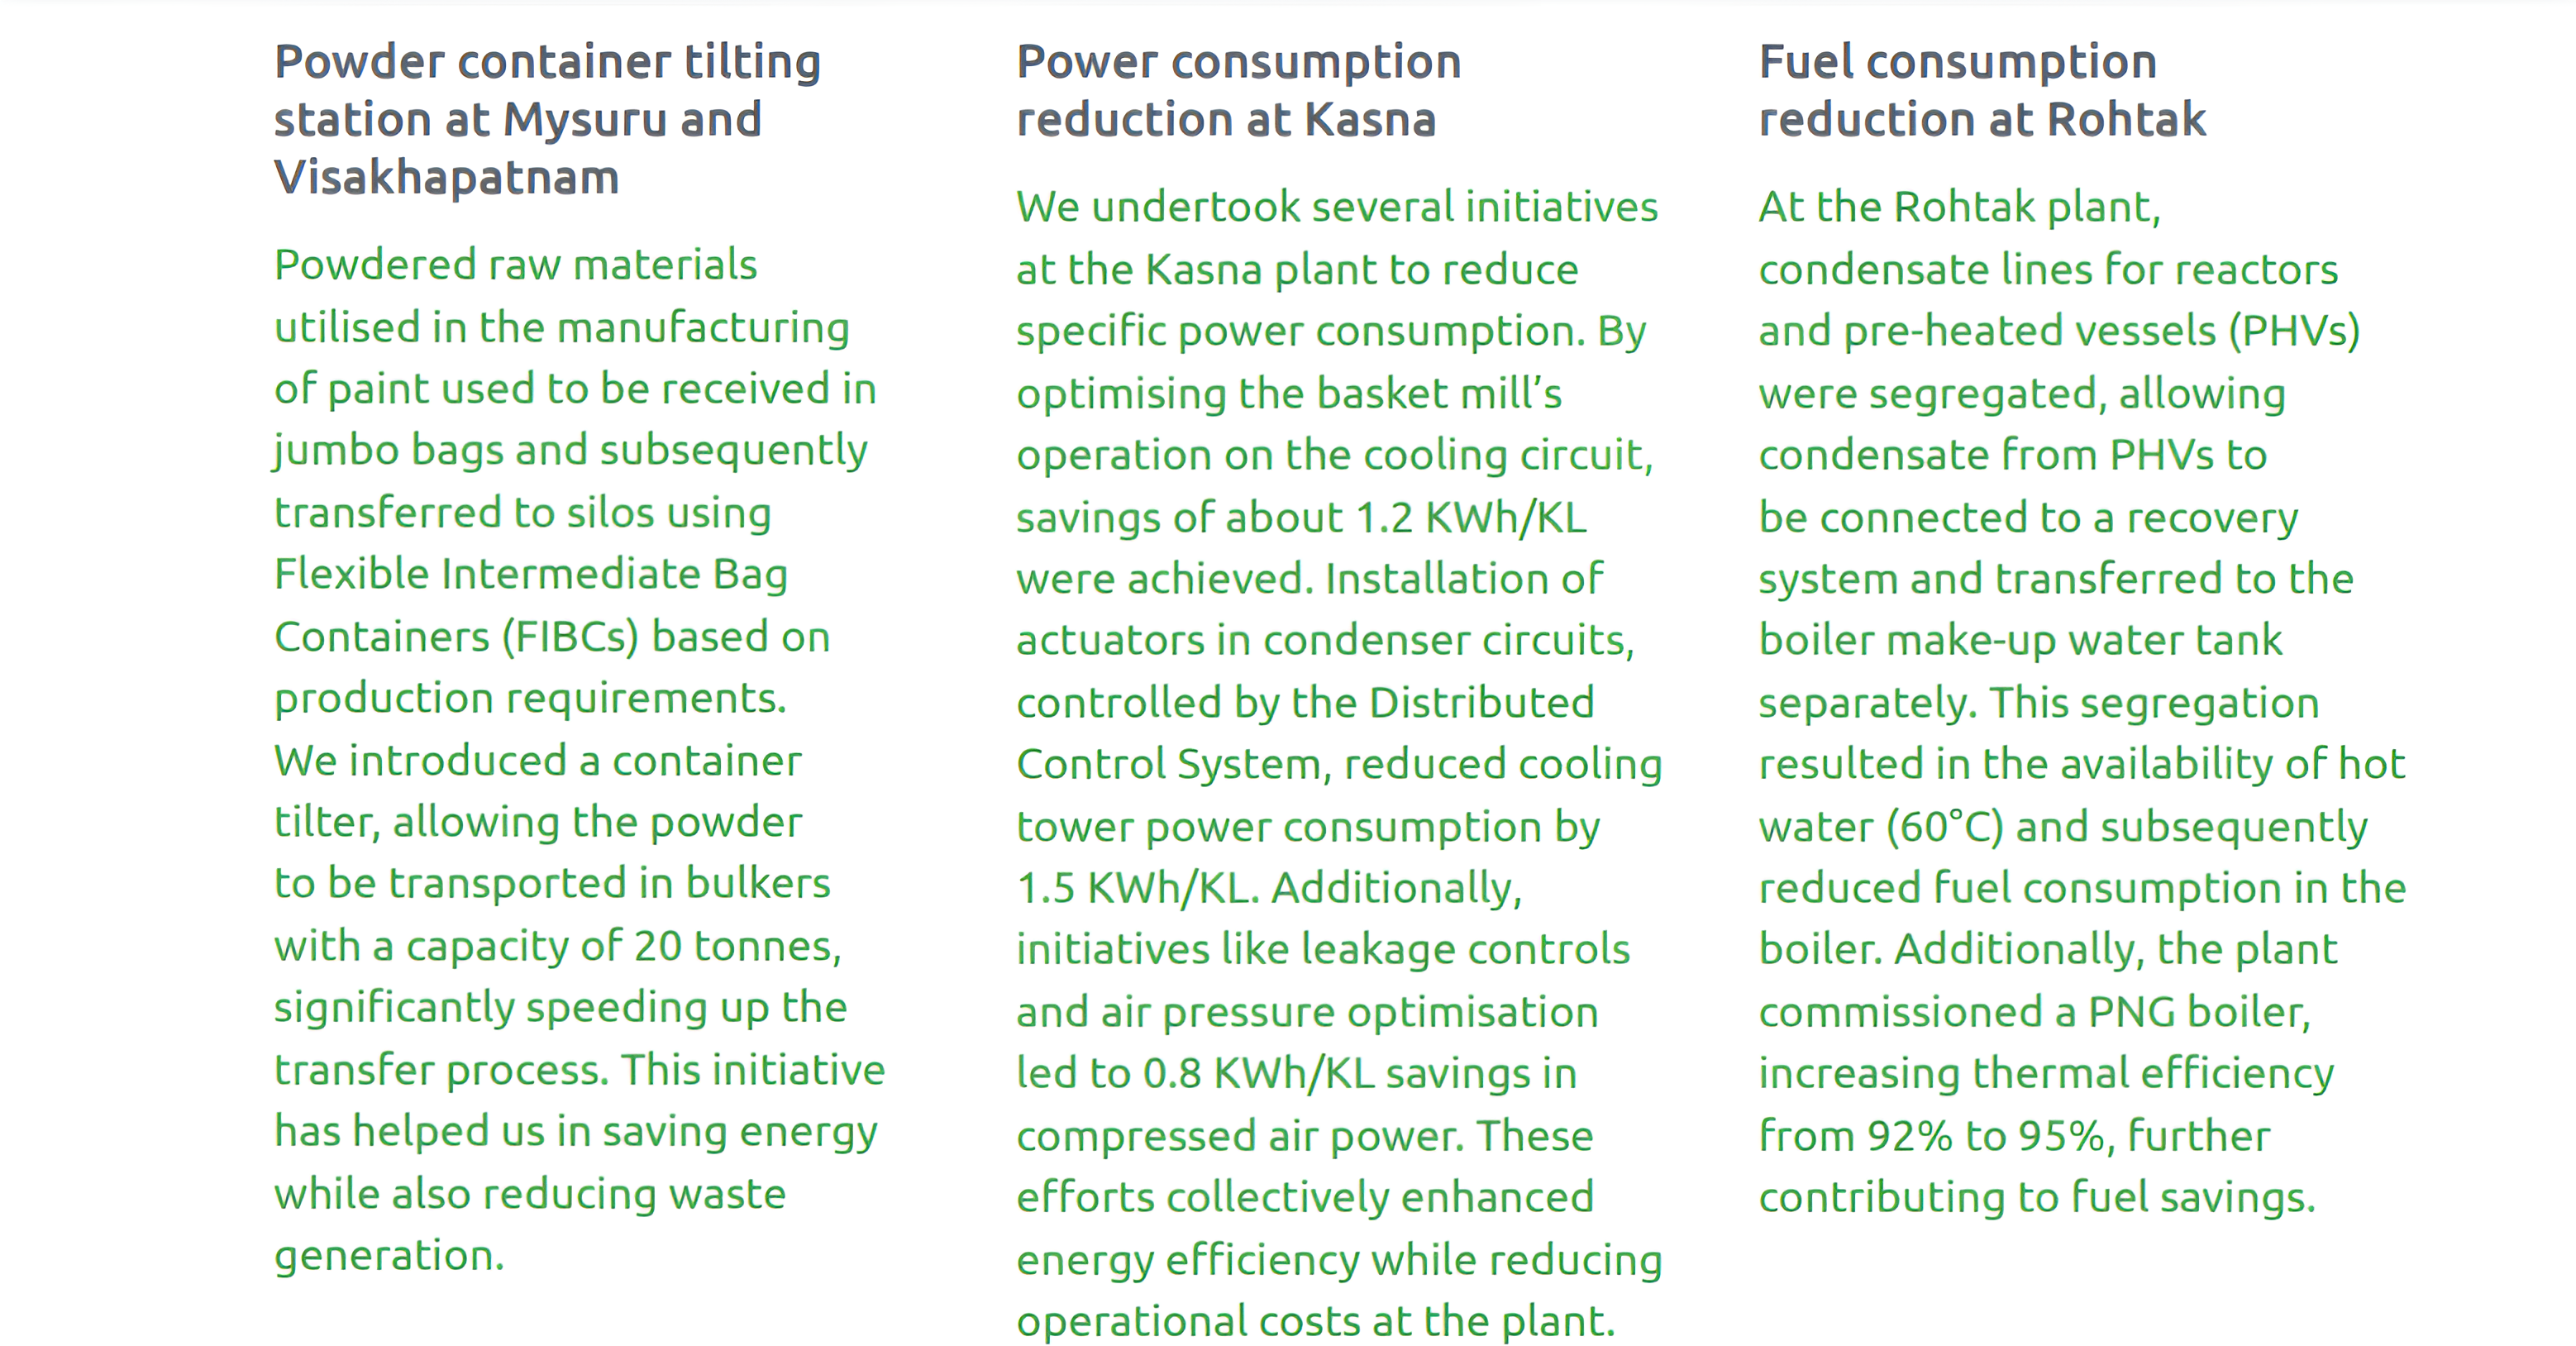
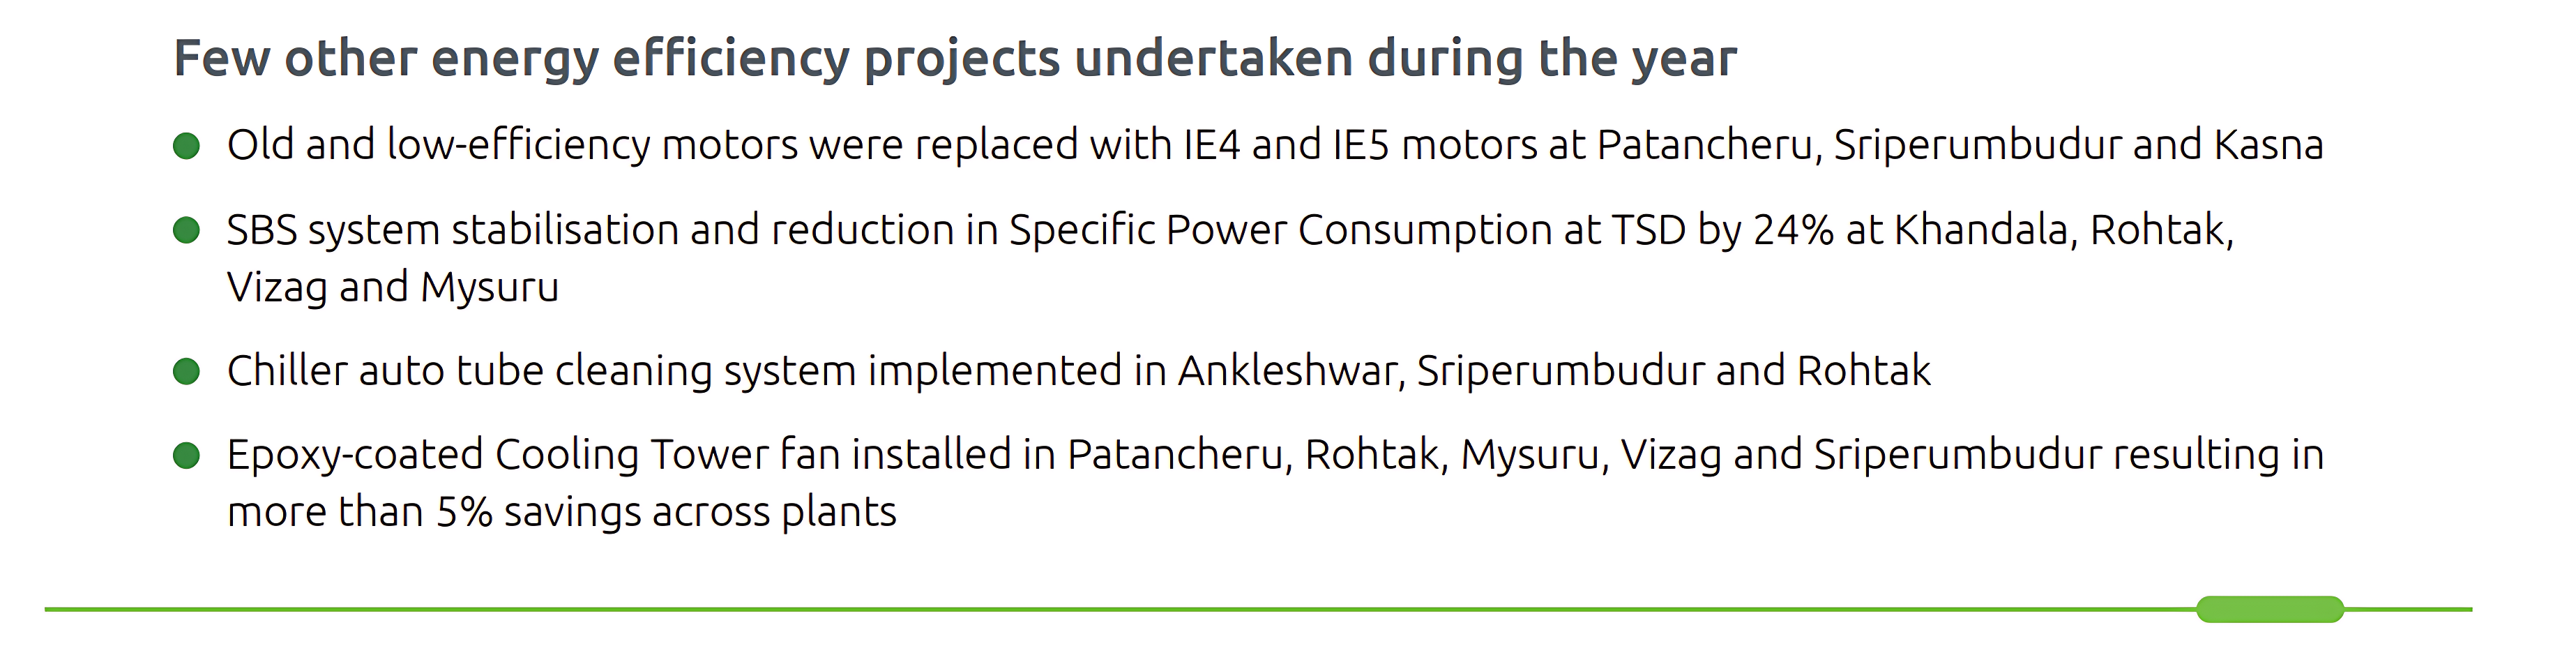
Through the monitoring of extensive data across plants using the Energy Management System (EMS) software, we track inefficiencies and generate insights for improvements. In addition, to strengthen our procedures, we have an effective energy audit system. With multiple interventions during the year, we were able to reduce our energy consumption by 1,972 GJ at our decorative paint manufacturing units.

E2.Renewable Energy
Over the past decade, we have made consistent progress in our transition to renewable energy through ongoing investments
in solar and wind electricity projects. Currently, our decorative paint manufacturing plants feature an installed capacity
of 48.9 MW, with 24.6 MW from solar installations and 24.3 MW from wind installations. The overall contribution of renewables
to our electricity consumption has risen to 65.8%, up from 62.2% in the previous year. Notably, we avoided emitting
6,164 tCO2
e through the increased use of renewable electricity at our decorative paint manufacturing units against last year’s
base. Furthermore, we are now working on increasing our reliance on biofuels for heating requirements.

Value Chain -Scope 3 Emissions
During the year, our total Scope 3 emissions were estimated at 33.2 lakh tCO 2
e.

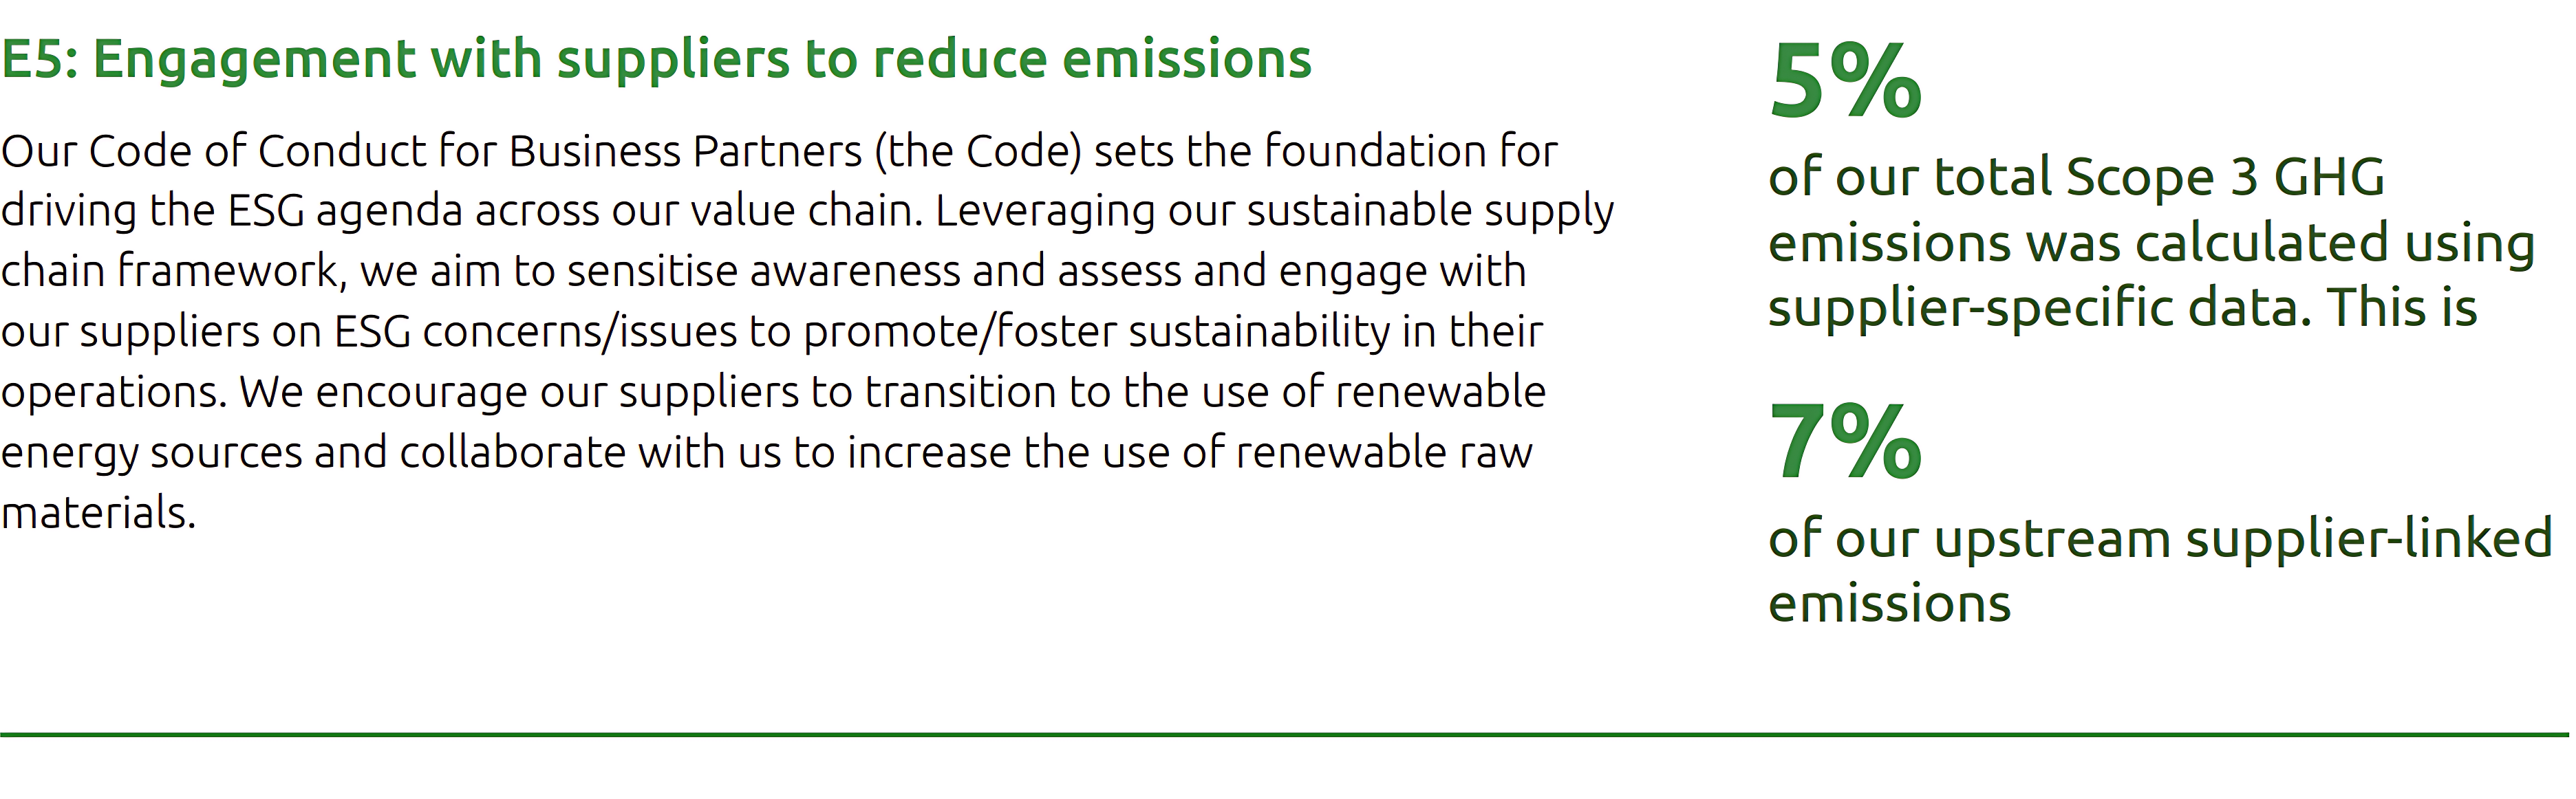

Supplier Engagement


During FY 2022-23, we carried out a climate risk assessment in line with the TCFD recommendations. The assessment covered
Physical and Transition Risks and involved identifying and engaging all relevant internal stakeholders, gathering inputs on key
issues, prioritising climate risks, utilising scenarios to spot risks and opportunities, evaluating business impact, devising potential
responses, and disclosing the findings.
The assessment helped us understand the Physical and Transition Risks we are exposed to, and while the exposure was minimal,
it encouraged us to strengthen our adaptation strategy with stronger resilience measures. The potential climate change
adaptation risks are part of our Risk Management framework. The detailed outcome of the assessment has been discussed in
our Sustainability Report for FY 2022-23.
Learn more about our approach to risk management in our TCFD Index.
The Physical Risk Analysis analysed
acute and chronic risks caused by
extreme weather events and longterm changes in climate patterns at
our 8 decorative paint manufacturing
locations in India.
The risks were analysed over the
short-term (2030) and long-term
(2050), using IPCC RCP 4.5 (moderate
climate change scenario) and RCP 8.5.
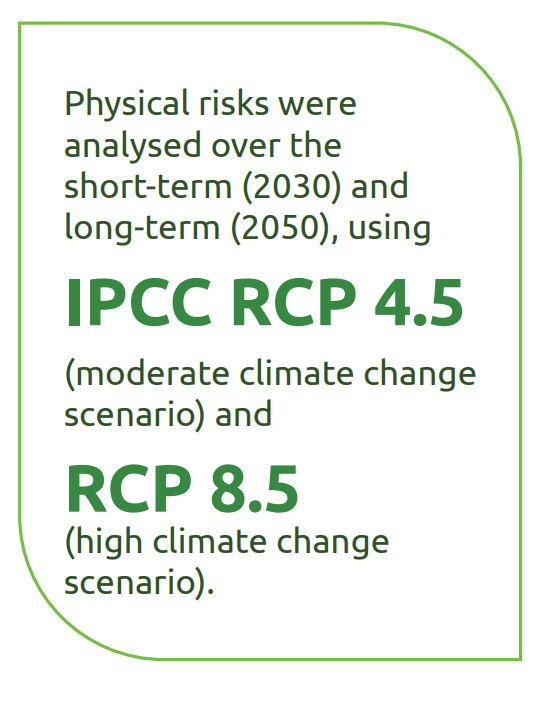
(high climate change scenario). To
facilitate effective decision-making, a
composite risk rating was calculated
based on the likelihood and impact
of the risks considering RCP 4.5 as
a probable scenario and short-term
(2030) time horizon for risks such as
heatwaves, drought, cyclones and
floods. Resilience measures are already
part of the design for climate events
like cyclones, and floods depending on
the geography. Similarly, our approach
towards addressing water risks
already encompasses the reduction
of non-process water consumption
as well as increasing rainwater and
greywater utilisation across our plants.
As per Central Ground Water Board’s
classification, none of our sites are
located in water-stressed areas. For
other physical risks, resilience measures
have been identified and are being
implemented to mitigate them.
During the year, we have undertaken
projects to improve ventilation on the
floor, augment rainwater harvesting
capacity within the plant, and intensify
our training and awareness efforts for
heatwave and monsoon preparedness
Transition Risk Analysis
Transitioning to a lower-carbon
economy may entail policy and
legal, technology, and market
changes that create both risks and
opportunities. Transition Risks include
policy and legal risks, market risks,
reputational risks and technology
risks as well as opportunities
under categories of products and
services, resource efficiency and
energy source. To analyse the risks
we could face, we conducted a
comprehensive assessment aligned
with the International Energy
Agency’s scenarios (IEA SDS) and
India’s Net Zero commitments and
current and anticipated policies.
Our comprehensive ESG agenda
strengthens our preparedness and
response to various identified risks
while also leveraging the opportunities
they present.